Air quality: how polluted is Datchet's air?

Vehicles produce significant amounts of nitrogen oxides, carbon monoxide, and other pollution
|
In June 2018, the Datchet Neighbourhood Plan team ordered Friends of the Earth air monitoring kits to measure the levels of nitrogen dioxide in our air. During the hot, dry spell from 17 June to 1 July 2018, these kits were positioned at four sites in the village:
|
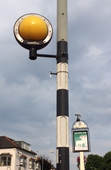
The testing sites


The results
The kits were returned to Friends of the Earth who measured the micrograms of nitrogen dioxide per cubic metre in the samples taken.
|
The results were:
1. High Street 31µg/m3 2. Village Green 40.9 µg/m3 3. Slough Road 28.5 µg/m3 4. Proposed housing site 32.5µg/m3 |
What do the results mean?
The European Union has set the legal limit for nitrogen dioxide (NO2) pollution at an annual mean of 40µg/m3. During the monitoring period, the NO2 pollution was 40.9µg/m3 at the zebra crossing on the Village Green. This is a snapshot of the air pollution for the place and time we were monitoring. Lots of things affect pollution levels over the course of a year, such as variations in the weather. The annual average results could look very different from these snapshots but without further monitoring we won't know. Air pollution levels also vary greatly depending on how close the tubes are to the traffic. There will be a reduction in levels even a few metres from the source.
What next?
These results will be used by Friends of the Earth to create a national air pollution map. Friends of the Earth says that most areas of the UK are currently failing to meet legal limits set by the EU, and that short term and long term exposure to NO2 can have significant negative health effects. Cancer, heart disease and asthma have all been linked to poor air quality, and it’s usually the most vulnerable in society, such as children and the elderly, who are at the most risk. NO2 can also affect vegetation.
We have passed on these results to Datchet Parish Council and have recommended that pollution levels are monitored throughout the village over a longer period. We are also forwarding the results to RBWM, which produces an annual Air Quality Report, and we will alert our local schools and the doctors’ surgery.
UPDATE: As a result of our findings, RBWM agreed to put up tubes and have been, and still are, monitoring at The Bridge, High Street and Queens Road, Their annual Air Quality Report, showing pollution levels at these sites, can be found on the RBWM website: https://www.rbwm.gov.uk/home/environment-and-waste/environmental-health/air-quality-annual-status-report-asr